


- Published on
Building a security tracing utility to snoop into the linux kernel
- Authors
- Name
- Luca Montechiesi
- lumontec
The story of how I built lsmtrace, a linux security modules introspection utility. A quick example demonstrating how it's possible to take a swim at the bottom of the linux kernel to observe security events triggered by a specific process. Leveraging krsi and ebpf this gets as easy as writing a simple c application. Almost..
Quest
During my quest for barely understandable technology I stumbled upon a really interesting feature released with kernel version v5.7 called krsi (kernel runtime security instrumentation) or bpf_lsm that allows developers to implement flexible linux security modules in userspace by exploiting the functionalities exposed by extended bpf. If you lack a basic idea of how these two techs work just jump to my previous post.
Beeing the tech super-fresh I culdn't find any project built on this in the open source community, so I started dreaming about developing one myself. That quickly made me want to discover more about the linux security modules framework, as well as realizing that the docs for the hundred+more hooks exposed by the kernel are quite thin.
Well.. we are in for some true fun.
I came to the conclusion that the best way for studying theese hooks was indeed to build some tool for observing them as they do their job, that's why I developed a simple utilty which i called lsmtrace.
lsmtrace
The idea of lsmtrace (linux security modules trace) is to dump every hook event triggered by a specific executable along with a meaningful view of the hook call arguments.
But what does that mean actually ?
Well the utility will basically do three things:
- Attach to all linux security modules hooks
- Spawn the process being monitored
- Dump events once hooks are triggered by the executable
Implementation
The utility can be simply divided in two distinct components:
- kernelspace bpf probe
- userspace executable
Both of them make extensive usage of libbpf library in order to:
- load and confiugure ebpf probe
- attach to hooks at the kernel side
- safely access information at the kernel side
- stream information to userspace using the bpf ringbuffer
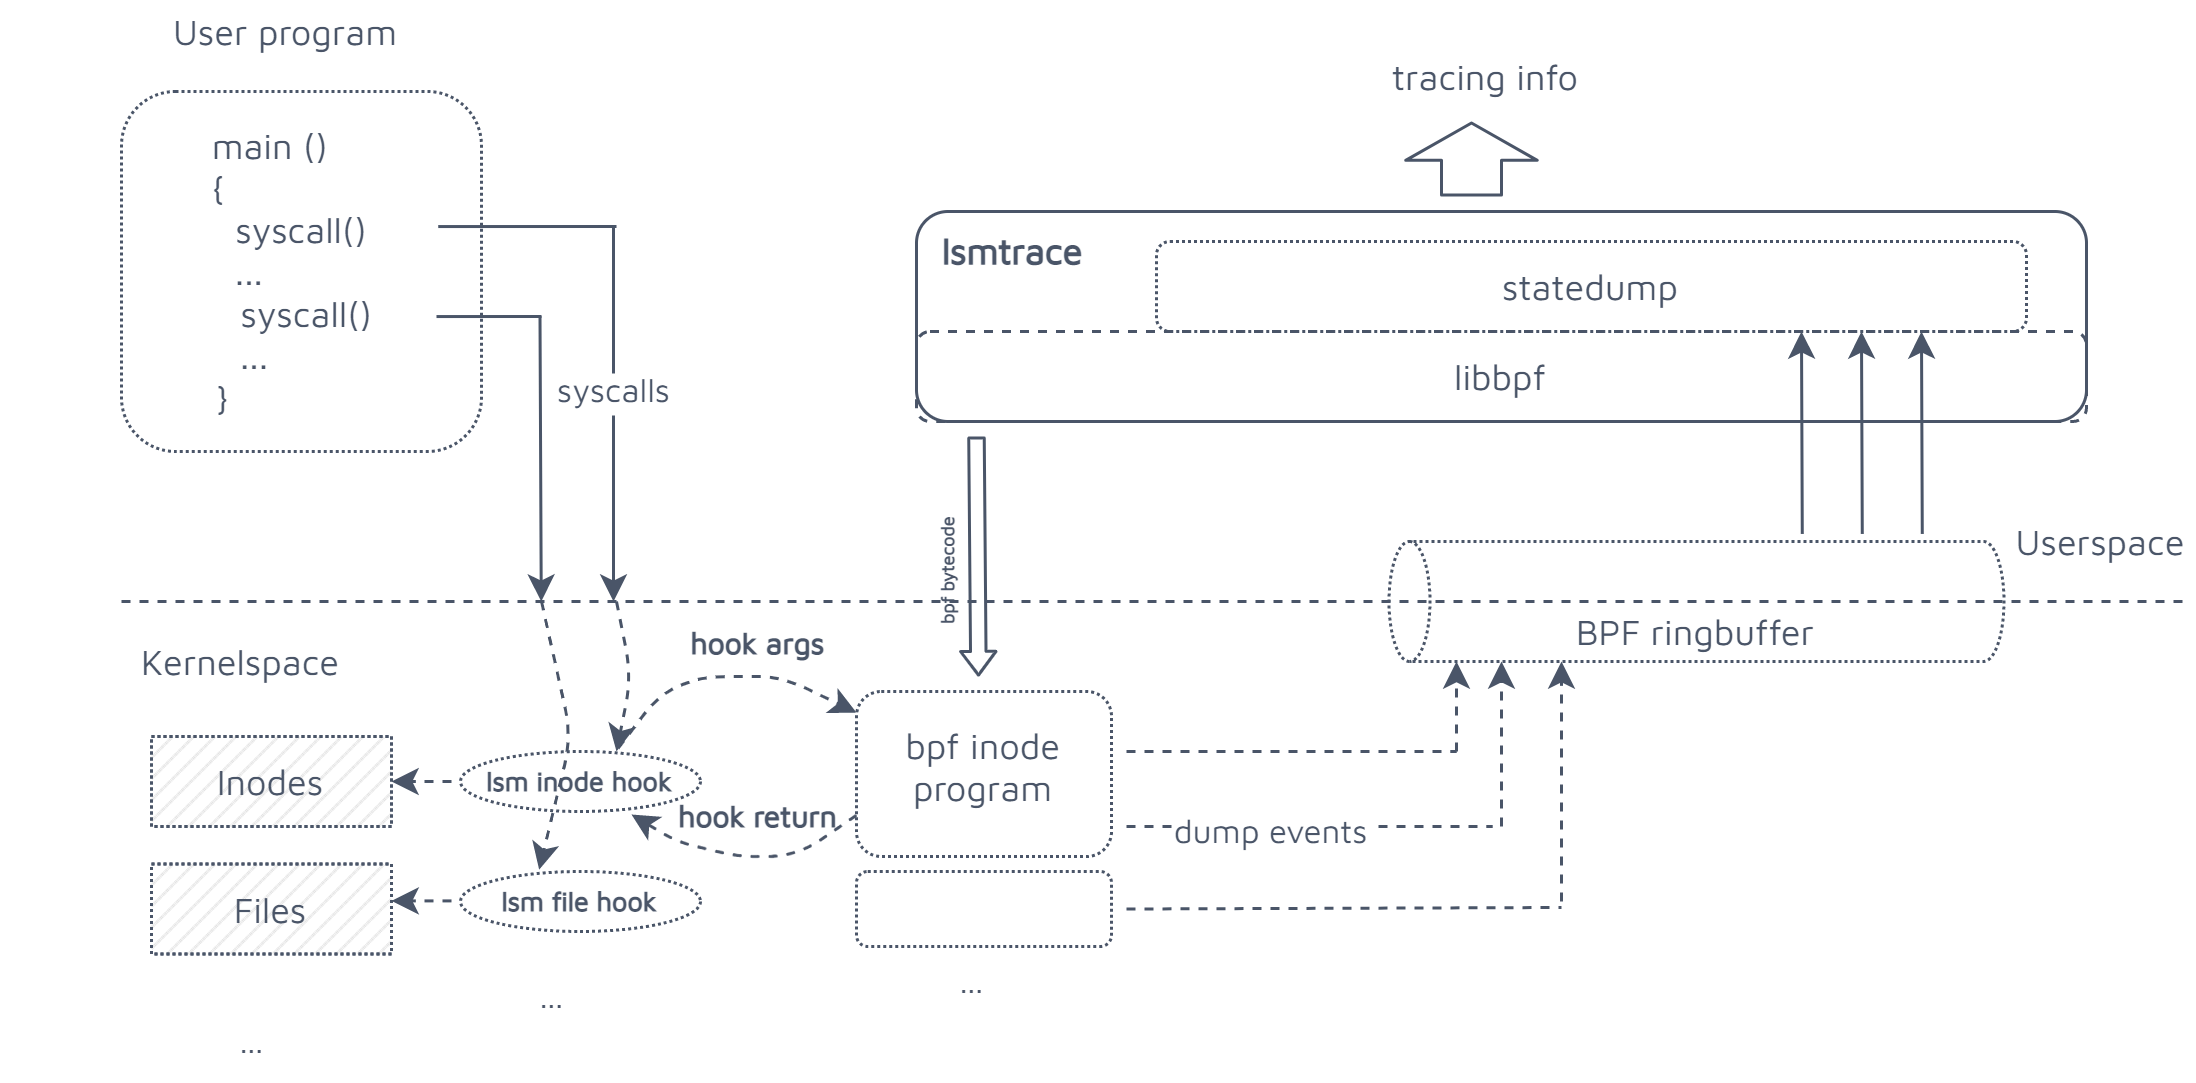
This architectural diagram should provide you with a mental representation of the details that follow:
kernelspace bpf probe
Contains the programs that will be attached to the hooks, every hook call will generate one or more events embedding information directly extracted by the hooks arguments. This will include:
- hook function signature
- struct arguments information
These events will be efficiently pushed to userspace by means of the bpf ringbuffer, a kernel bpf facility of type BPF_MAP_TYPE_RINGBUF implementing an in-kernel circular buffer which can be used to stream information to userspace. Thus every kernel hook will have attached a simple program declared as follows:
SEC("lsm/file_open")
int BPF_PROG(file_open, struct file *file)
{

    FILTER_CATHEGORY_INT(FILE_CATH)
    FILTER_OWN_PID_INT()
    DUMP_FUNC(file_open, struct file *file)

    DUMP_FILE_STRUCT(file)

    bpf_printk("lsm_hook: file: file_open\n");
    return 0;
}
Without entering in too much detail, we simply declare the hook we will attach to, with the arguments that will be passed, and we call a number of macros which basically have theese roles:
FILTER_CATHEGORY_INT() filter out hook cathegory (set by userspace at probe launch) FILTER_OWN_PID() filter hook calls related to specific pid (set by userspace at probe launch) DUMP_FUNC() dump hook signature event (push to ringbuf) DUMP_FILE_STRUCT() dump view of the file struct (push to ringbuf) In addition for debug purposes we trace the operation with bpf_printk accessible at:
cat /sys/kernel/debug/tracing/trace_pipe What follows is an example implementation of one of the previous event dump macros:
#define DUMP_FUNC(FNAME, ...) {                             \
    const char func_call_name[] = #FNAME;                   \
    const char func_call_args[] = #__VA_ARGS__;             \
    dump_func(func_call_name, func_call_args);              \
}

...

static int dump_func(const char *fname, const char *fargs) {

    struct func_call_Event *evt;
    char func_call_label[] = "HOOK_CALL";

    evt = bpf_ringbuf_reserve(&ringbuf, sizeof(*evt), ringbuffer_flags);

    if (!evt)
        return -1;

    evt->super.etype = FUNCTION_CALL;

    bpf_probe_read_str(evt->super.label, sizeof(evt->super.label), func_call_label);
    bpf_probe_read_str(evt->name, sizeof(evt->name), fname);
    bpf_probe_read_str(evt->args, sizeof(evt->args), fargs);

    bpf_ringbuf_submit(evt, ringbuffer_flags);

    return 0;
}
As you see inside the dump_func definition, we simply allocate a new event and mark it with a label, we set the name and the arguments. In order to push this information to the ringbuffer we need to first reserve enough space with bpf_ringbuf_reserve and submit the forged event with bpf_ringbuf_submit
You may have immediately noticed a couple of quirks:
Most of this code operates on variables by making use of specific helper functions (e.g.
bpf_prove_read_strexposed along with the previous ones by the libbpf library. This required in order to safely read information inside the kernelThe macro definition has a strange form, declares a local string inside a code block then calls
dump_func()passing this string. This is required because declaring a string literal outside of the block generates an errorlibbpf: elf: skipping unrecognized data section(6) .rodata.str1.1due to the fact that libbpf does not seem to support string literals in the rodata elf section atm. To work around this probelm a simple quick solution is to declare the literal inside a code block in such a way that it can be simply allocated on the stack.
A similar logic is also implemented to dump hook arguments, referring to the file_open() call for example we can extract information from the file struct as follows:
/* file */
#define DUMP_FILE_STRUCT(...) {                                     \
    DUMP_MEMBER_UINT(__VA_ARGS__,f_mode)                            \
    DUMP_DENTRY_STRUCT(__VA_ARGS__,f_path.dentry)                   \
}

...

#define DUMP_MEMBER_UINT(...) {                                     \
    const char dump_member_name[] = #__VA_ARGS__;                   \
    unsigned int mptr = BPF_CORE_READ(__VA_ARGS__);                 \
    dump_uint_member(dump_member_name, mptr);                       \
}
As you see nested macro definitions have been implemented in order to allow reuse of DUMP...STRUCT() logic.
Macro BPF_CORE_READ() is a libbpf helper which allows us to safely access kernel structure members across different versions.
This post will provide you with much greater detail.
userspace executable
At the userspace side the application entrypoint looks more or less like this:
...
    /* Parse command line arguments */
    err = argp_parse(&argp, argc, argv, 0, NULL, NULL);
    if (err)
        return err;
...

    int child_pid = exec_prog_and_wait(my_exec_path, my_exec_argv);
...
    /* Configure bpf probe with init values */
    skel->bss->my_pid = child_pid;
    skel->rodata->cathegory = argp_args.cathegory;
...

    /* Attach tracepoints */
    err = lsmtrace_bpf__attach(skel);
    if (err) {
        log_err("Failed to attach BPF skeleton\n");
        goto cleanup;
    }

    /* Send child cont signal */
    log_verb("Attached, starting execution\n");
    kill(child_pid, SIGCONT);

    /* Set up ring buffer polling */
    ringbuffer = ring_buffer__new(bpf_map__fd(skel->maps.ringbuf), handle_event, NULL, NULL);
    if (!ringbuffer) {
        err = -1;
        log_err("Failed to create ring buffer\n");
        goto cleanup;
    }
...
    while (!exiting) {
...

        err = ring_buffer__poll(ringbuffer, 100 /* timeout, ms */);
...
    }
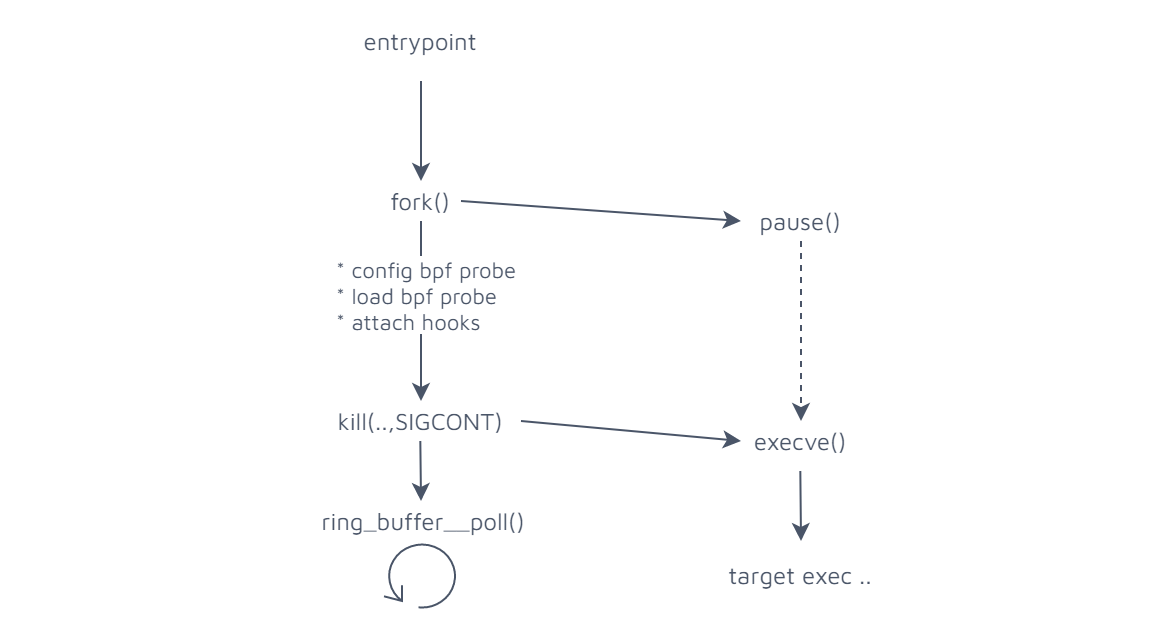
This is pretty straightforward, but just to sum it up: after parsing command line args we spawn the target executable to be traced, then we initialize the bpf probe with the target executable pid and attach it to the hooks. Right after that we see that a kill(child_pid,SIGCONT) signal is sent to our process. That happens because the new process is paused as soon as it's spawned by the main thread, so that it can be conveniently converted by an execve() call right after all hooks have been attached at the kernel side. After all this we just sit there polling the ringbuffer for new events through ring_buffer__poll() call. The flow should be quite similar to this:
Once events get intercepted by the userspace, they are simply cast from generic polymorphic type Event to the specific type so that it can be printed to stdout. All this happens inside a specific statedump library module. Follws definition of the types and example of a simple event dump method for strings:
/* events.h */

typedef struct Event {
    enum Event_type etype;
    char label[MAX_LABEL_SIZE];
} Event;
...
typedef struct str_member_Event {
    Event super;
    char member[MAX_STR_SIZE];
    char msg[MAX_MSG_SIZE];
} str_member_Event;
...

/* statedump.c */

int printStrMemberEvt(const struct Event *evt) {
    const str_member_Event* tevt = (str_member_Event*) evt;
    log_info("     %s = ", tevt->msg);
    log_info("%s\n", tevt->member);
    return 0;
}
Let`s have some fun
Ok, enough talking, let's see what lsmtrace actually does in action.
As an extremely simple example we want to snoop all kernel security events triggered by the execution of an embarassingly simple ls /home command. In order to achieve this we simply launch something like lsmtrace [executable] -a "args" where -a flag specifies eventual arguments which may be passed to the executable.
Functionality was extended to dump raw events when syscalls are entered and exited, in order to enrich lsm hook events with additional context which is quite important to understand what is actually happening under the hood.
A couple details
- In order to run this you will need a linux kernel > 5.7 compiled with the following options (in future distro kernel upstream releases these are likely to be enabled by default):
- BPF_SYSCALL
- DEBUG_INFO
- DEBUG_INFO_BTF
- BPF_LSM
By now you will have to pass the full path of the executable, so if launching
lsjust pass/usr/bin/lsAttaching all the linux security module hooks is not immediate with bpf, so just wait some seconds and just don't get mad
Please run this thing
Ok let's see it in action (i filtered the output a little as it gets quite verbose):
$ sudo ./lsmtrace /usr/bin/ls -a "/home"

Attaching hooks, don`t rush..

-> SYS_CALL_EXIT:   pause
...
-> SYS_CALL_ENTER:  rt_sigreturn
-> SYS_CALL_EXIT:
...
-> SYS_CALL_ENTER:  execve
-> HOOK_CALL: -> vm_enough_memory( struct mm_struct *mm, long pages )
-> HOOK_CALL: -> cred_prepare( struct cred *new, const struct cred *old, gfp_t gfp )
-> HOOK_CALL: -> file_alloc_security( struct file *file )
From the start it's already quite clear what is happening if we keep an eye on the previous flow diagram: first the child process is unpaused then execve() syscall is called in order to execute the actual /usr/bin/ls /home command.
What happens underneath is quite interesting: since the executable has to be mapped to virtual memory a first check is made on available pages with vm_enough_memory() hook so that we can efficiently avoid to request pages to the kernel if none is available. cred_prepare() and file_alloc_security setup security credentials for executable by copying the old ones and allocate the initial file->f_security struct (have a look here to dig deeper),
But let's move on..
-> HOOK_CALL: -> inode_permission( struct inode *inode, int mask )
     inode,i_ino = 2
     inode,i_mode = 16877
...
-> HOOK_CALL: -> inode_permission( struct inode *inode, int mask )
     inode,i_ino = 3670017
...
-> HOOK_CALL: -> inode_permission( struct inode *inode, int mask )
     inode,i_ino = 3670018
     inode,i_mode = 16877
...
-> HOOK_CALL: -> inode_permission( struct inode *inode, int mask )
     inode,i_ino = 3670696
     inode,i_mode = 33261
...
-> HOOK_CALL: -> file_open( struct file *file )
     file,f_path.dentry,d_name.name = ls
     file,f_path.dentry,d_inode,i_ino = 3670696
...
Permission is requested for three inodes, can you guess who are they ? Let's see..
$ ls -id /
2 /
$ ls -id /usr
3670017 /usr
$ ls -id /usr/bin
3670018 /usr/bin
Once the thread has jumped on each of these inodes file_open() hook is triggered for ls in order to actually start loading the executable...
As you can see the level of detail is extreme, just consider that we havn't even opened the executable to be loaded, so allow me to quickly jump to the points that imho are the most juicy.
-> HOOK_CALL: -> inode_follow_link( struct dentry *dentry, struct inode *inode, bool rcu )
     dentry,d_name.name = lib
     dentry,d_inode,i_ino = 14
...
-> HOOK_CALL: -> file_open( struct file *file )
     file,f_mode = 32769
     file,f_path.dentry,d_flags = 0
     file,f_path.dentry,d_name.name = ld-2.32.so
...
-> HOOK_CALL: -> bprm_committing_creds( struct linux_binprm *bprm )
     bprm,file,f_path.dentry,d_name.name = ls
     bprm,file,f_path.dentry,d_inode,i_ino = 3670696
-> HOOK_CALL: -> bprm_committed_creds( struct linux_binprm *bprm )
     bprm,file,f_path.dentry,d_name.name = ls
     bprm,file,f_path.dentry,d_inode,i_ino = 3670696
What happens here is quite interesting: symlinks are followed through lib up to ld-2.32.so which is the dynamic linker, which is now invoked in order to launch our actual executable since this has to be linked against several dyamic libraries, more on that in a minute. bprm_committing_creds and bprm_committed_creds will officially commit new security credentials for the executable, that is finally ok to be launched.
-> HOOK_CALL: -> mmap_file( struct file *file, unsigned long reqprot, unsigned long prot, unsigned long flags )
     file,f_mode = 32797
     file,f_path.dentry,d_flags = 64
     file,f_path.dentry,d_name.name = ls
...
-> HOOK_CALL: -> mmap_file( struct file *file, unsigned long reqprot, unsigned long prot, unsigned long flags )
     file,f_mode = 32797
     file,f_path.dentry,d_flags = 0
     file,f_path.dentry,d_name.name = ld-2.32.so
The executable and dynamic linker are finally mapped to virtual memory.
-> SYS_CALL_EXIT:   execve
     ret: 0
-> SYS_CALL_ENTER:  brk
-> SYS_CALL_EXIT:   brk
     ret: 94264417042432
-> SYS_CALL_ENTER:  arch_prctl
-> SYS_CALL_EXIT:   arch_prctl
     ret: -22
-> SYS_CALL_ENTER:  access
-> HOOK_CALL: -> cred_prepare( struct cred *new, const struct cred *old, gfp_t gfp )
-> HOOK_CALL: -> inode_permission( struct inode *inode, int mask )
     inode,i_ino = 2
> HOOK_CALL: -> inode_permission( struct inode *inode, int mask )
     inode,i_ino = 524289
-> SYS_CALL_EXIT:   access
     ret: -2
At this point we notice execve() giving the way to brk() syscall (likely coming from a malloc() call to check the end of the heap segment), arch_prctl() which is used to set up thread local storage and access() syscallwhich seem to fail with 2 = ENOENT code.
If we have a look deeper with strace we can see that the process is trying to access /etc/ld.so.preload which is a list of libraries that should be preloaded before the others. This is happily ignored so that the process can go on with its dance..
-> SYS_CALL_ENTER:  openat
...
-> HOOK_CALL: -> file_open( struct file *file )
     file,f_path.dentry,d_name.name = libselinux.so.1
     file,f_path.dentry,d_inode,i_ino = 3677561
...
-> SYS_CALL_ENTER:  read
-> HOOK_CALL: -> file_permission( struct file *file, int mask )
     file,f_path.dentry,d_name.name = libselinux.so.1
     file,f_path.dentry,d_inode,i_ino = 3677561
-> SYS_CALL_EXIT:   read
     ret: 832
...
-> SYS_CALL_ENTER:  mmap
-> HOOK_CALL: -> mmap_file( struct file *file, unsigned long reqprot, unsigned long prot, unsigned long flags )
     file,f_mode = 32797
     file,f_path.dentry,d_flags = 0
     file,f_path.dentry,d_name.name = libselinux.so.1
...
-> SYS_CALL_ENTER:  openat
...
-> HOOK_CALL: -> file_open( struct file *file )
     file,f_path.dentry,d_name.name = libc-2.32.so
...
At this time the process starts accessing and loading the dynamic dependencies through p/read() and mmap() syscalls.
Reading on faster through the stream of events we get:
-> SYS_CALL_ENTER:  ioctl
-> HOOK_CALL: -> file_ioctl( struct file *file, unsigned int cmd, unsigned long arg )
     file,f_path.dentry,d_name.name = out
...
 -> SYS_CALL_ENTER:  openat
...
-> HOOK_CALL: -> file_open( struct file *file )
     file,f_mode = 32769
     file,f_path.dentry,d_flags = 16448
     file,f_path.dentry,d_name.name = home
     file,f_path.dentry,d_inode,i_ino = 3014657
...
-> SYS_CALL_ENTER:  fstat
-> SYS_CALL_EXIT:   fstat
...
-> SYS_CALL_ENTER:  getdents64
-> HOOK_CALL: -> file_permission( struct file *file, int mask )
     file,f_path.dentry,d_name.name = home
     file,f_path.dentry,d_inode,i_ino = 3014657
-> SYS_CALL_EXIT:   getdents64
     ret: 104
...
We observe that stdout is setup by ioctl() call and eventually this is where the executable does the actual job, by accessing the file /home and calling fstat() and getdents64() syscalls to gather information about its dentries.
In an effort not to get killed I will spare you the details of how the whole process is terminated after the job, but if yout want to find it out you can play with the sources and have a little of fun.
Back to the port
What I showed you here was meant to be two things:
- A real world application leveraging KRSI for monitoring
- A deeper approach for reverse engineering a specific executable behavior against your OS kernel
I am perfectly aware that part of or maybe even all these functionalities could be implemented by leveraging bpftrace but the intent of lsmtrace is to provide a plug and play functionality exposing a view of the kernel structures related to specific hook calls, just as strace does with syscalls.
I am currently extending this information along with my need to access it, so as you might expect, although all hook calls are currently implemented, not all their struct arguments are dumped to console. Yet thanks to the helper macros available in the project, adding new ones should be a matter of minutes.
If you find this useful or you want to play with the code HERE you can find everything you need, feel free to open PRs or file issues and don't hesitate to contact me if you want to talk about this topic and much more. I am always happy to chat about technology.
Want to talk about this post? Discuss this on Medium →